
| 일 | 월 | 화 | 수 | 목 | 금 | 토 |
|---|---|---|---|---|---|---|
| 1 | ||||||
| 2 | 3 | 4 | 5 | 6 | 7 | 8 |
| 9 | 10 | 11 | 12 | 13 | 14 | 15 |
| 16 | 17 | 18 | 19 | 20 | 21 | 22 |
| 23 | 24 | 25 | 26 | 27 | 28 | 29 |
| 30 |
- Numpy
- synology
- SciPy
- LSTM
- pandas
- E-P1
- Series
- dataframe
- Python
- SPL
- pip
- mean
- GitHub
- install
- Splunk
- javascript
- 알고리즘
- DFS
- pycharm
- GT-S80
- ipad
- CNN
- imread
- Lotto
- 삼성소프트웨어멤버십
- RNN
- index
- Button
- mariadb
- keras
- Today
- Total
잠토의 잠망경
[Splunk] lecture Form & Token 본문

Lab13 - Search 1에서 검색에서 열기 클릭
다른이름으로 저장 → 대시보드 패널 클릭
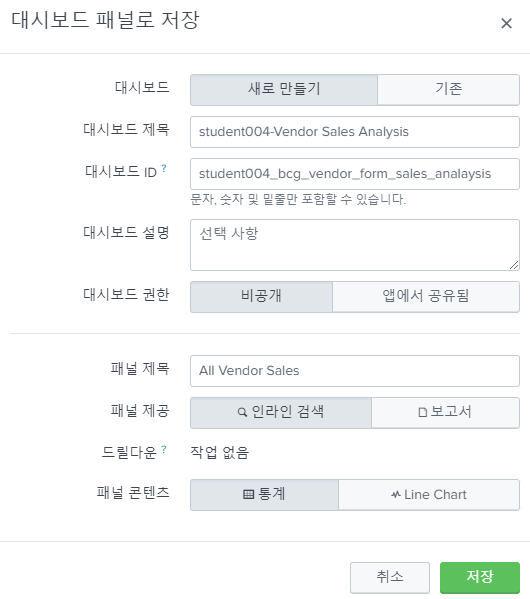
아래 내용 추가한다.
| 대시보드 | 새로 만들기 |
| 대시보드 제목 | student004-Vendor Sales Analysis |
| 대시보드 ID | student004_bcg_vendor_form_sales_analaysis |
| 패널 제목 | All Vendor Sales |
| 패널 제공 | 인라인 검색 |
| 패널 콘텐츠 | 통계 |

편집 클릭
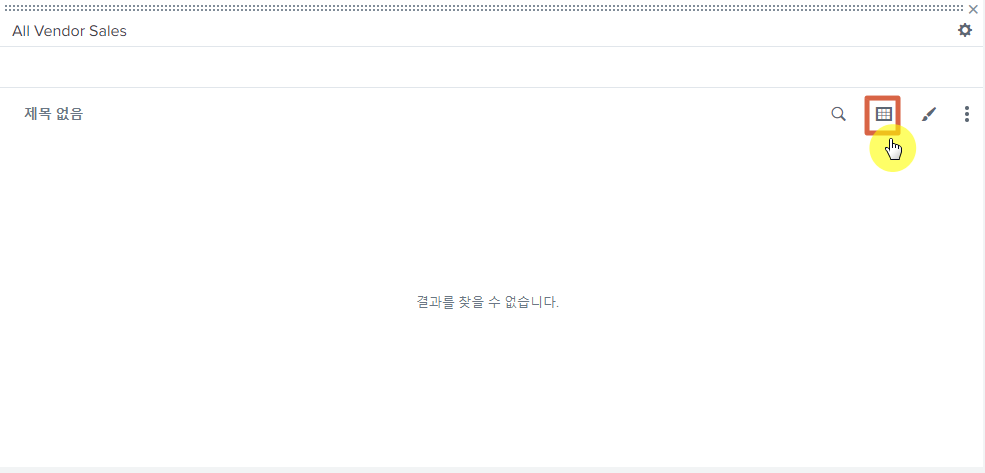
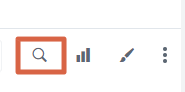
돋보기(검색 편집) 클릭
sourcetype="vendor_sales" v_country_tok v_state_tok v_city_tok
| timechart count
내용을 아래와 같이 수정한다.
sourcetype="vendor_sales" $v_country_tok$ $v_state_tok$ $v_city_tok$
| timechart count
그리고 적용 클릭 한다.
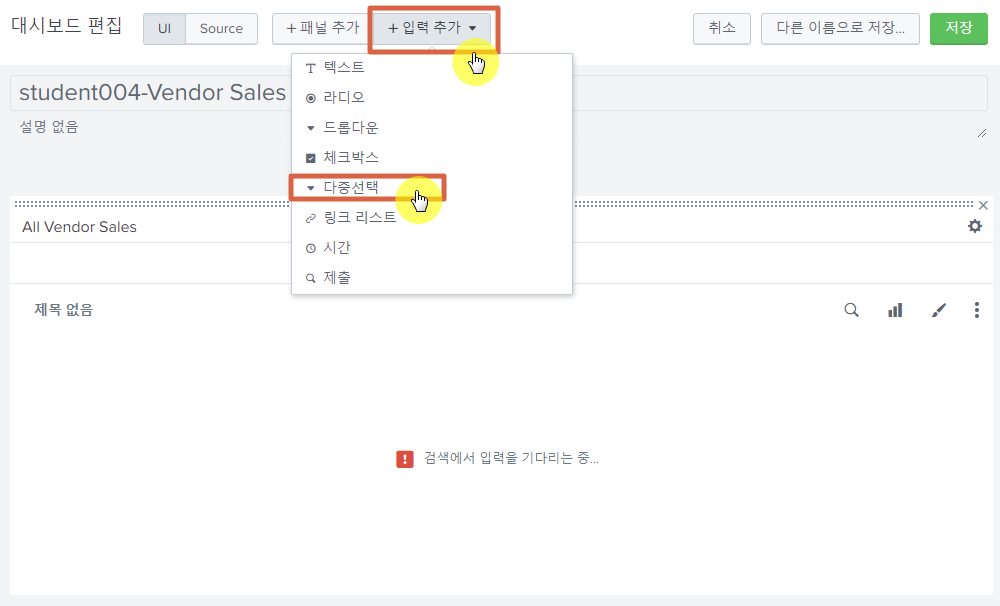
+입력추가 → 다중선택 클릭 한다. ( 총 3개를 만들어야 한다. Country, State, City)

펜(Input) 모양을 클릭한다. 그리고 아래와 같은 내용으로 기입한다.
| 일반 | 레이블 | Country | |
| 변경사항 검색 | 체크 | ||
| 토큰 옵션 | 토큰 | v_country_tok | $v_country_tok$ 와 mapping |
| 기본값 | 모두 | 제일 마지막에 입력 | |
| 초기값 | |||
| 토큰 접두사 | ( | ||
| 토큰 접미사 | ) | ||
| 토큰 값 접두사 | VendorCountry=" | ||
| 토큰 값 접미사 | " | ||
| 구분자 | OR | OR 앞/뒤에 공백 추가 | |
| 정적옵션 | 이름 | All | |
| 값 | * | ||
| 동적옵션 | 콘텐츠 유형 | 인라인 검색 | |
| 검색 문자열 | sourcetype="vendor_sales" | stats count by "VendorCountry" |
||
| 시간 선택 | Last 7 days | ||
| 레이블로 사용할 필드 | VendorCountry | ||
| 값으로 사용할 필드 | VendorCountry |
| 일반 | 레이블 | State/Province | |
| 변경사항 검색 | 체크 | ||
| 토큰 옵션 | 토큰 | v_state_tok | $v_country_tok$ 와 mapping |
| 기본값 | 모두 | 제일 마지막에 입력 | |
| 초기값 | |||
| 토큰 접두사 | ( | ||
| 토큰 접미사 | ) | ||
| 토큰 값 접두사 | VendorStateProvince=" | ||
| 토큰 값 접미사 | " | ||
| 구분자 | OR | OR 앞/뒤에 공백 추가 | |
| 정적옵션 | 이름 | All | |
| 값 | * | ||
| 동적옵션 | 콘텐츠 유형 | 인라인 검색 | |
| 검색 문자열 | sourcetype="vendor_sales" $v_country_tok$ | stats count by "VendorStateProvince" |
||
| 시간 선택 | Last 7 days | ||
| 레이블로 사용할 필드 | VendorStateProvince | ||
| 값으로 사용할 필드 | VendorStateProvince |
| 일반 | 레이블 | City | |
| 변경사항 검색 | 체크 | ||
| 토큰 옵션 | 토큰 | v_city_tok | $v_country_tok$ 와 mapping |
| 기본값 | 모두 | 제일 마지막에 입력 | |
| 초기값 | |||
| 토큰 접두사 | ( | ||
| 토큰 접미사 | ) | ||
| 토큰 값 접두사 | VendorCity=" | ||
| 토큰 값 접미사 | " | ||
| 구분자 | OR | OR 앞/뒤에 공백 추가 | |
| 정적옵션 | 이름 | All | |
| 값 | * | ||
| 동적옵션 | 콘텐츠 유형 | 인라인 검색 | |
| 검색 문자열 | sourcetype="vendor_sales" $v_country_tok$ $v_state_tok$ |stats count by "VendorCity" |
||
| 시간 선택 | Last 7 days | ||
| 레이블로 사용할 필드 | VendorCity | ||
| 값으로 사용할 필드 | VendorCity |
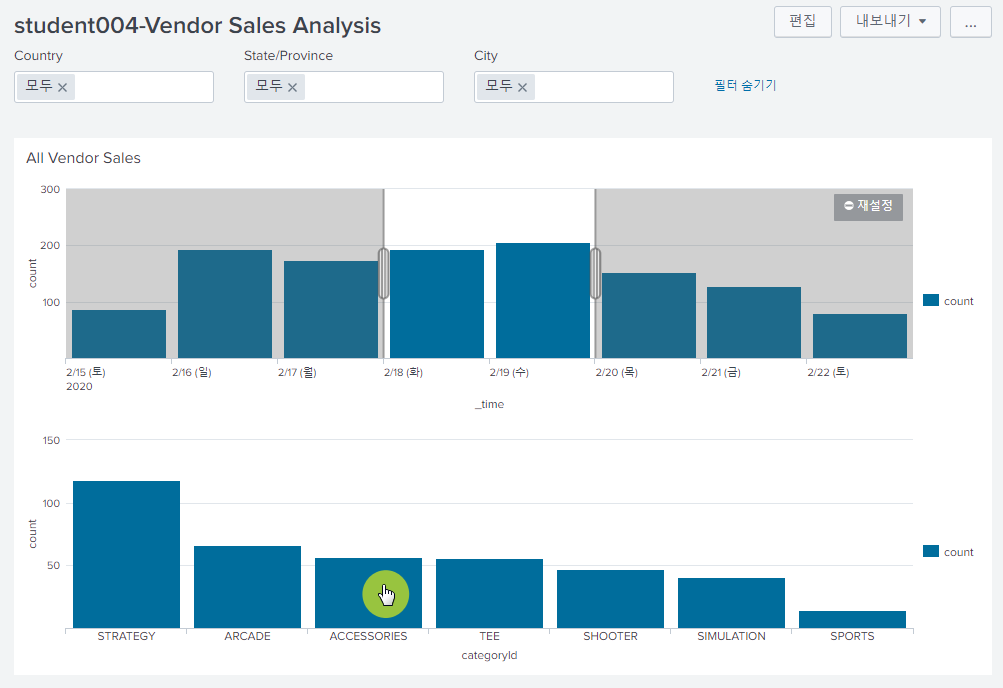
총 3개의 다중 선택을 추가하면 다음과 같이 나온다.

입력값을 이리저리 넣어 보자
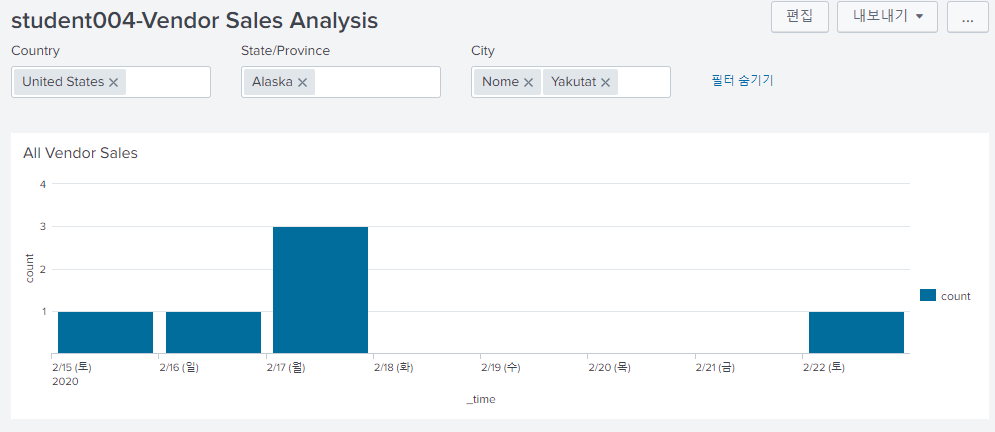
입력된 결과에 맞춰서 내용이 변경 된다.
sourcetype="vendor_sales" (VendorCountry="United States") (VendorStateProvince="Alaska") (VendorCity="Nome" OR VendorCity="Yakutat")
| timechart count
입력된 결과는 다음과 같다.
다양한 입력 결과는 아래와 같다.
sourcetype="vendor_sales" (VendorCountry="United States") (VendorStateProvince="Alaska") (VendorCity="*")
| timechart count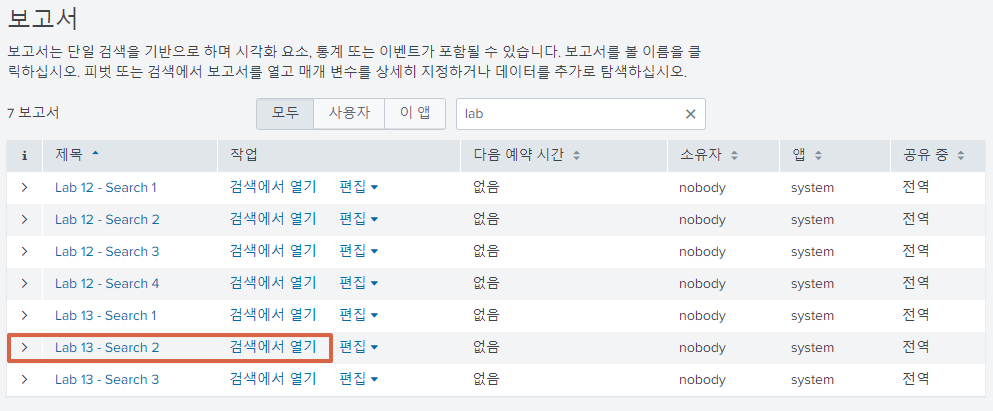
Lab13-Search2 의 검색에서 열기 클릭
sourcetype="vendor_sales" v_country_tok v_state_tok v_city_tok
| stats count by categoryId
| sort - count
다른이름으로 저장 → 대시보드로 만들기

저장을 누르고 이동한다.

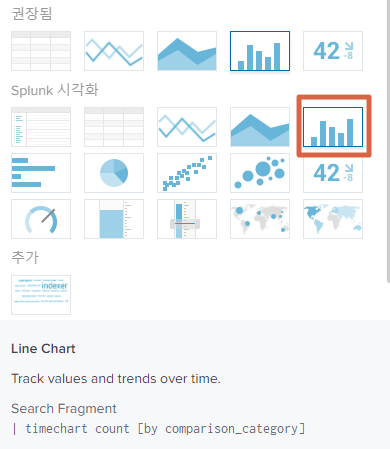
방금 추가된 시각화를 Column Chart로 변경한다.
검색 편집을 누른다.

검색 문자열을 수정해야한다.
sourcetype="vendor_sales" v_country_tok v_state_tok v_city_tok
| stats count by categoryId
| sort - count
변경 전의 모습이고 다음은 변경 후의 모습이다.
sourcetype="vendor_sales" $v_country_tok$ $v_state_tok$ $v_city_tok$
| stats count by categoryId
| sort - count
input 값으로 처리한 변수를 수정하였다.

이렇게 생긴 차트들을 아래와 같이 변경할 꺼다.

이를 위해서는 아래 박스를 삭제 처리해야 한다.

Pan & Zoom

All Vendor Sales의 선택으로 아래 Chart가 변경되는 것을 시험해 볼꺼다.
편집 → Source 클릭한다.
다음과 같이 수정한다.
<row>
    <panel>
      <title>All Vendor Sales</title>
      <chart>
        <search>
          <query>sourcetype="vendor_sales" $v_country_tok$ $v_state_tok$ $v_city_tok$
| timechart count</query>
          <earliest>-7d@h</earliest>
          <latest>now</latest>
          <sampleRatio>1</sampleRatio>
        </search>
        <option name="charting.chart">column</option>
        <option name="refresh.display">progressbar</option>
        <selection>
          <set token="selection.earliest">$start$</set>
          <set token="selection.latest">$end$</set>
        </selection>
      </chart>
      <title>Sales by Category</title>
      <chart>
        <search>
          <query>sourcetype="vendor_sales" $v_country_tok$ $v_state_tok$ $v_city_tok$
| stats count by categoryId
| sort - count</query>
          <earliest>$selection.earliest$</earliest>
          <latest>$selection.latest$</latest>
        </search>
        <option name="charting.chart">column</option>
        <option name="charting.drilldown">none</option>
        <option name="refresh.display">progressbar</option>
      </chart>
    </panel>
</row>| All Vendor Sales | Triger역할 |
| Sales by Category | 해당 값을 받아오는 역할 |
      <title>Sales by Category</title>
      <chart>
        <search>
          <query>sourcetype="vendor_sales" $v_country_tok$ $v_state_tok$ $v_city_tok$
                | stats count by categoryId
                | sort - count</query>
          <earliest>$selection.earliest$</earliest>
          <latest>$selection.latest$</latest>
        </search>
        <option name="charting.chart">column</option>
        <option name="charting.drilldown">none</option>

        <option name="refresh.display">progressbar</option>
      </chart>
    </panel>
  </row>
</form>
<title>Sales by Category</title>
      <chart>
        <search>
          <query>sourcetype="vendor_sales" $v_country_tok$ $v_state_tok$ $v_city_tok$
                | stats count by categoryId
                | sort - count</query>
          <earliest>$selection.earliest$</earliest>
          <latest>$selection.latest$</latest>
        </search>
        <option name="charting.chart">column</option>
        <option name="refresh.display">progressbar</option>
        <drilldown>
          <link>
            <![CDATA[/app/search/student004_bcg_vendor_sales_drilldown_destination?from.categoryId=$click.value$&earliest=$earliest$&latest=$latest$]]>
          </link>
        </drilldown>
      </chart>
    </panel>
  </row>
</form>
sourcetype="vendor_sales" categoryId=categoryId
| stats sparkline as "Trend", values(Vendor) as "Vendors", values(product_name) as "Products Sold" by VendorCountry
| rename VendorCountry as Country
대시보드 만들기
| Category | Value |
| 대시보드 | 새로만들기 |
| 대시보드 제목 | student004-Sales Drilldown Destination |
| 대시보드 ID | student004_bcg_vendor_sales_drilldown_destination |
| 대시보드 권한 | 비공개 |
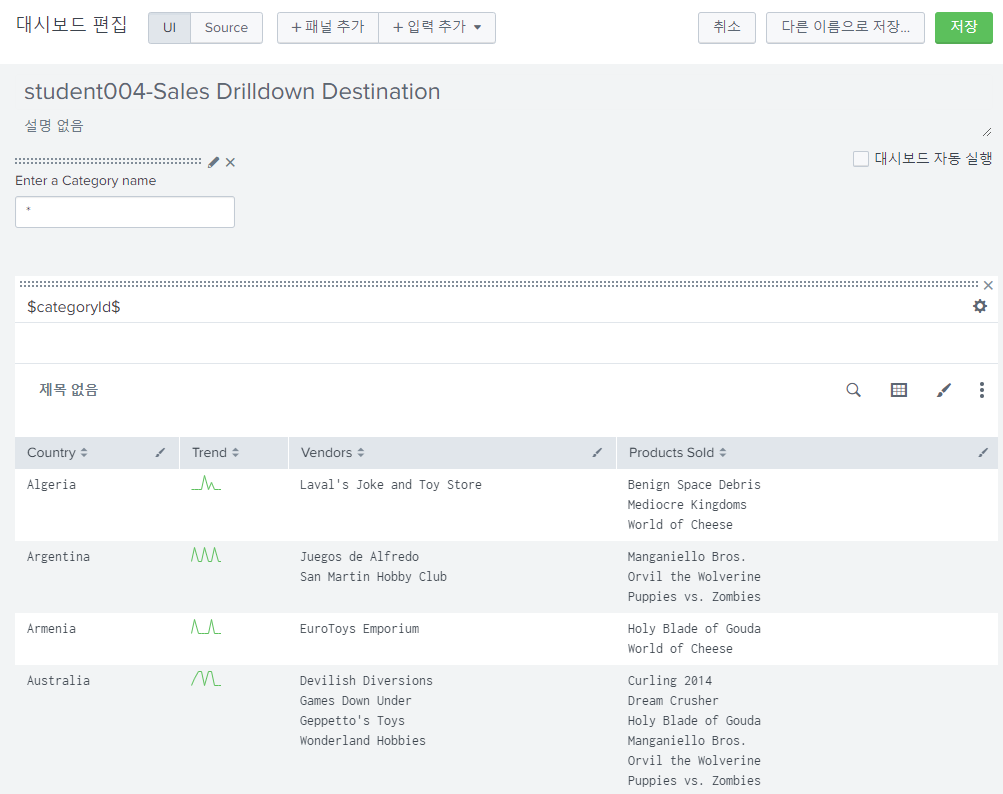
| 패널 제목 | $categoryId$ |
| 패널 제공 | 인라인 검색 |
| 패널 콘텐츠 | 통계 |

편집 클릭한다

검색 편집 클릭 한다.
검색 편집
sourcetype="vendor_sales" categoryId=categoryId
| stats sparkline as "Trend", values(Vendor) as "Vendors", values(product_name) as "Products Sold" by VendorCountry
| rename VendorCountry as Country
위내용을 아래와 같이 수정한다.
sourcetype="vendor_sales" categoryId=$categoryId$
| stats sparkline as "Trend", values(Vendor) as "Vendors", values(product_name) as "Products Sold" by VendorCountry
| rename VendorCountry as Country
수정 사항은 $categoryId$ 이다.

입력추가 → T 텍스트 클릭한다.
| 일반 | 레이블 | TimeEnter a Category name | |
| 변경사항 검색 | |||
| 토큰 옵션 | 토큰 | categoryId | |
| 기본값 | * | ||
| 초기값 | |||
| 토큰 접두사 | |||
| 토큰 접미사 | |||
| 토큰 값 접두사 | |||
| 토큰 값 접미사 |
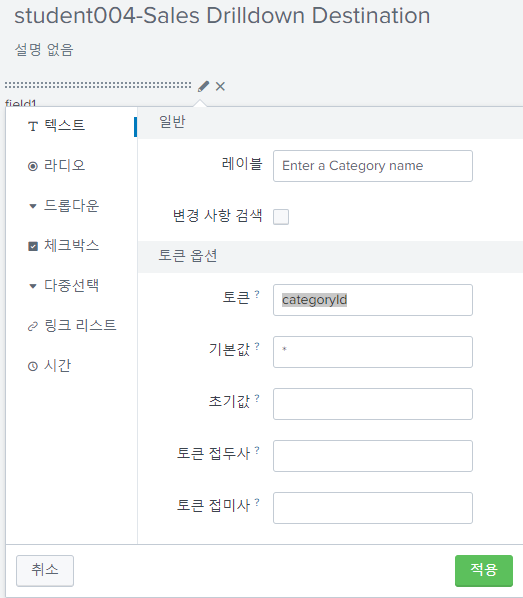
입력을 위와 같이 완료하면 아래와 같이 나오게 된다.
시간 추가하기
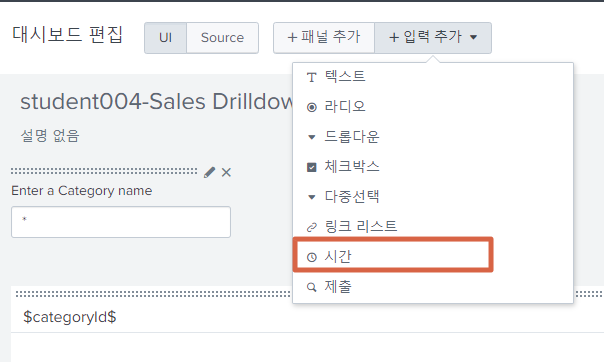

| Category | 값 | |
| 레이블 | Time | |
| 토큰 | 삭제 처리 | |
| 기본값 | Last 7 days |
동작 확인
web page open된다.


