| 일 | 월 | 화 | 수 | 목 | 금 | 토 |
|---|---|---|---|---|---|---|
| 1 | ||||||
| 2 | 3 | 4 | 5 | 6 | 7 | 8 |
| 9 | 10 | 11 | 12 | 13 | 14 | 15 |
| 16 | 17 | 18 | 19 | 20 | 21 | 22 |
| 23 | 24 | 25 | 26 | 27 | 28 | 29 |
| 30 |
Tags
- pandas
- mean
- Splunk
- Series
- Button
- GT-S80
- LSTM
- dataframe
- install
- CNN
- SciPy
- DFS
- keras
- imread
- synology
- Numpy
- mariadb
- ipad
- RNN
- GitHub
- 삼성소프트웨어멤버십
- pip
- pycharm
- Lotto
- index
- E-P1
- javascript
- Python
- SPL
- 알고리즘
Archives
- Today
- Total
잠토의 잠망경
[scipy] gaussian_filter1d 본문
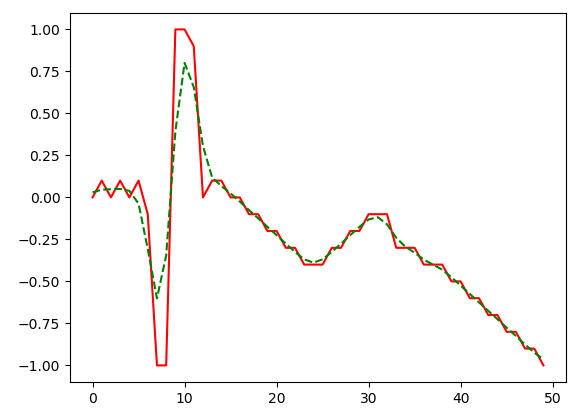
line chart의 noise를 제거하기 위하여 gaussian filter를 사용하였다.
해당 chart는 1차원으로 1d 함수를 사용하였다.
sigma에 따른 결과를 아래와 같이 볼수 있다.
g1 = gaussian_filter1d(g, sigma=1)
g1 = gaussian_filter1d(g, sigma=2)

g1 = gaussian_filter1d(g, sigma=3)
여러개를 보자

def showgausiandata():


    #임의 data
    np.random.seed(280490)
    datas = np.random.randn(101).cumsum()


    # 실험해볼 sigma들
    sigmas = np.asarray([0.3, 1, 2, 3, 4, 5])


    # chart용
    fig = plt.figure()
    axlist = []

    for i in range(len(sigmas)):
        axlist.append(fig.add_subplot(2, 3, i+1))

    for i in range(len(sigmas)):

        g_datas = gaussian_filter1d(datas, sigma=sigmas[i])

        axlist[i].plot(range(len(datas)), datas, label='sigma: {}'.format(sigmas[i]))
        axlist[i].plot(range(len(g_datas)), g_datas, '--', label='sigma: {}'.format(sigmas[i]))
        axlist[i].set_title(label='sigma: {}'.format(sigmas[i]))


    plt.show()
※ 참고
https://docs.scipy.org/doc/scipy/reference/generated/scipy.ndimage.gaussian_filter1d.html
Comments
